情境
可觀測性與監控工具包
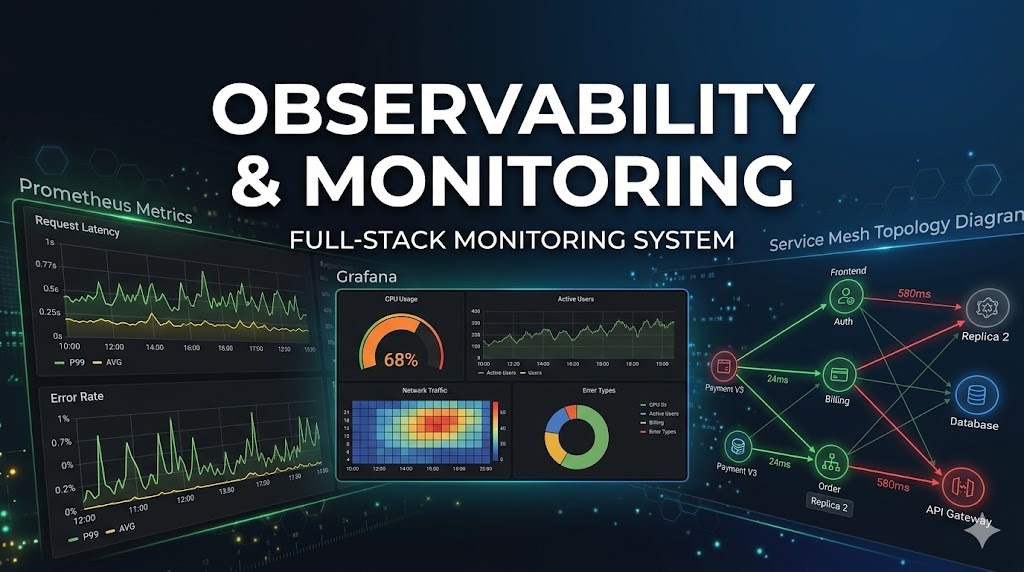
全端可觀測性 — Prometheus 指標收集、Grafana 儀表板建立,以及用於生產環境監控的 service mesh 分散式追蹤。
6 技能 2 安裝次數
observabilitymonitoringprometheusgrafanatracingsredevops
4 天前更新
安裝
執行此指令以安裝此技能包中的所有技能:
npx skillstore add @observability-monitoring-toolkit CLI 會自動偵測 Codex 與 Claude Code 資料夾;如果兩者都可用,會同時安裝。
總覽
使用指南
詳細指南
## 概覽

可觀測性與監控工具包整合了三項生產等級技能,用於建構完整的可觀測性堆疊 — 使用 Prometheus 收集指標、在 Grafana 儀表板中視覺化指標,並跨 service mesh 追蹤請求。

## 快速開始

1. 安裝 plugin:`npx skillstore add @observability-monitoring-toolkit`
2. 使用 **prometheus-configuration** 設定指標收集 — 定義 scrape targets、recording rules 與 alerting thresholds
3. 使用 **grafana-dashboards** 建立儀表板 — 以經驗證的版面配置模式,為系統與應用程式指標建立 panels
4. 使用 **service-mesh-observability** 加入分散式追蹤 — 為 Istio 或 Linkerd 實作 tracing、SLO monitoring 與 mesh-level metrics

## 主要命令

- **prometheus-configuration** — `Set up Prometheus for comprehensive metric collection, storage, and monitoring` — scrape configs、recording rules、alertmanager integration
- **grafana-dashboards** — `Create and manage production Grafana dashboards` — panel templates、variable-driven layouts、alert annotations
- **service-mesh-observability** — `Implement comprehensive observability for service meshes` — distributed tracing、mesh metrics、SLO dashboards

## 提示

- 先從 **prometheus-configuration** 開始定義你的 metrics pipeline,接著使用 **grafana-dashboards** 透過預先建立的 panel patterns,視覺化那些精確的指標。
- 當你需要跨 microservices 追蹤 latency 時,請使用 **service-mesh-observability** — 它以 request-level tracing context 補足 Prometheus point-in-time metrics。
技能
6📦
prometheus-configuration
中風險 73設定 Prometheus 監控
團隊需要可靠的 Prometheus 設定,能收集有用的指標,同時避免嘈雜的規則或故障的抓取作業。此技能會引導 Claude、Codex 和 Claude Code 完成抓取設定、記錄規則、警示規則和驗證步驟。
🔧 DevOps 與基礎設施 由 wshobson ⚙️🌐
📦
grafana-dashboards
安全 81建置生產環境 Grafana 儀表板
團隊需要能呈現服務健康狀態,且不含雜訊或令人困惑面板的儀表板。此技能可協助 Claude、Codex 和 Claude Code 使用經驗證的可觀測性模式來設計 Grafana 儀表板。
🔧 DevOps 與基礎設施 由 wshobson
📦
service-mesh-observability
中風險 72監控服務網格可靠性
服務網格團隊需要清楚掌握延遲、錯誤、流量與服務相依性。此技能提供適用於常見網格工具的追蹤、指標、儀表板與警示實用範本。
🔧 DevOps 與基礎設施 由 wshobson ⚙️🌐