مُنسَّق
Observability & Monitoring Toolkit
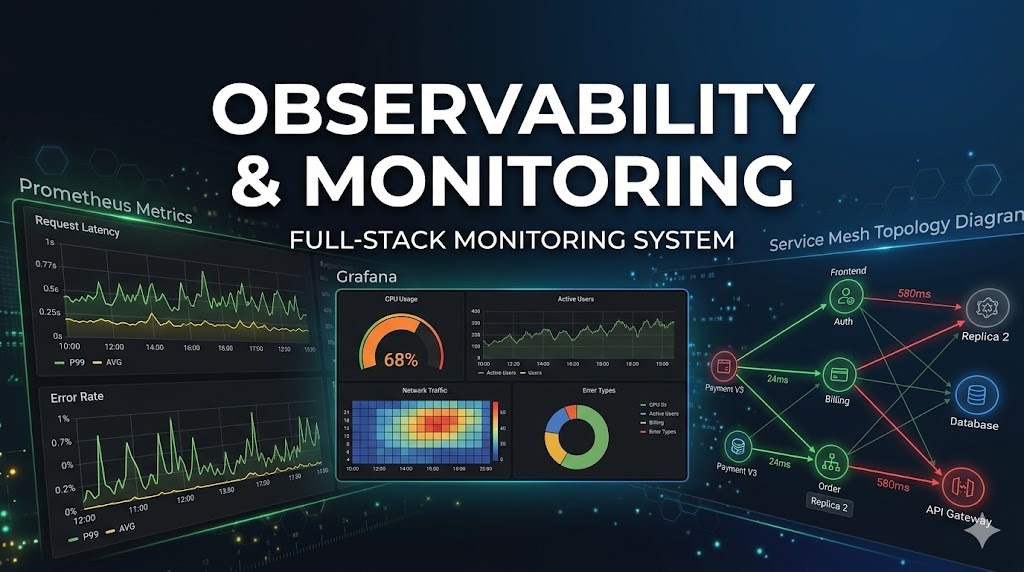
Full-stack observability — Prometheus metrics collection, Grafana dashboard creation, and service mesh distributed tracing for production monitoring.
6 مهارات 2 عمليات التثبيت
observabilitymonitoringprometheusgrafanatracingsredevops
تم التحديث قبل 66 يومًا
تثبيت
شغّل هذا الأمر لتثبيت جميع المهارات في هذا المكوّن الإضافي:
npx skillstore add @observability-monitoring-toolkit سيتم تثبيت المهارات في الدليل .claude/skills/
نظرة عامة
دليل الاستخدام
دليل مفصل
## Overview

Observability & Monitoring Toolkit bundles three production-grade skills for building a complete observability stack — collect metrics with Prometheus, visualize them in Grafana dashboards, and trace requests across service meshes.

## Quick Start

1. Install the plugin: `npx skillstore add @observability-monitoring-toolkit`
2. Set up metric collection with **prometheus-configuration** — define scrape targets, recording rules, and alerting thresholds
3. Build dashboards with **grafana-dashboards** — create panels for system and application metrics with proven layout patterns
4. Add distributed tracing with **service-mesh-observability** — implement tracing, SLO monitoring, and mesh-level metrics for Istio or Linkerd

## Key Commands

- **prometheus-configuration** — `Set up Prometheus for comprehensive metric collection, storage, and monitoring` — scrape configs, recording rules, alertmanager integration
- **grafana-dashboards** — `Create and manage production Grafana dashboards` — panel templates, variable-driven layouts, alert annotations
- **service-mesh-observability** — `Implement comprehensive observability for service meshes` — distributed tracing, mesh metrics, SLO dashboards

## Tips

- Start with **prometheus-configuration** to define your metrics pipeline, then use **grafana-dashboards** to visualize those exact metrics with pre-built panel patterns.
- Use **service-mesh-observability** when you need to trace latency across microservices — it complements Prometheus point-in-time metrics with request-level tracing context.
المهارات
6📈
prometheus-configuration
مخاطر منخفضة 68Prometheus 모니터링 구성
Prometheus 설정은 복잡하고 잘못 구성하기 쉽습니다. 이 기술은 스크래핑, 규칙, 검증에 대한 명확한 예제를 제공하여 강력한 모니터링을 구현하는 데 도움이 됩니다.
🔧 DevOps والبنية التحتية بواسطة wshobson 🌐⚙️
📊
grafana-dashboards
آمن 69검증된 패턴으로 Grafana 대시보드 구축
구조화되지 않은 대시보드는 노이즈를 생성하고 사고 대응 속도를 저하시킵니다. 이 스킬은 팀이 즉시 대응할 수 있는 효과적인 모니터링 대시보드 구축을 위한 명확한 레이아웃, 패널 예제 및 알림 패턴을 제공합니다.
🔧 DevOps والبنية التحتية بواسطة wshobson 🌐⚙️📁
🔭
service-mesh-observability
آمن 69서비스 메시 관측 가능성 빠르게 설정하기
서비스 메시 원격 측정은 추적, 메트릭, 대시보드 간에 연결하기 어렵습니다. 이 스킬은 Istio 및 Linkerd 관측을 위한 준비된 템플릿과 쿼리를 제공합니다.
🔧 DevOps والبنية التحتية بواسطة wshobson 🌐⚙️📁